Typically, demand curves have the quantity on the x-axis and price on the y-axis; these are the graphs of inverse demand functions
Especially useful if trying to find the price of a good given a quantity
Parameter of inverse demand function is quantity
Using the Cobb-Douglas utility function: u(x1,x2)=x1ax2bA Cobb-Douglas demand function looks like (x1∗,x2∗)=((a+b)p1am,(a+b)p2bm)The inverse demand function would be (p1,p2)=((a+b)x1∗am,(a+b)x2∗bm)With perfect complements: u(x1,x2)=min{x1,x2}The demand function looks like (x1∗,x2∗)=(p1+p2m,p1+p2m)The inverse demand function would be (p1,p2)=(x1∗m−p2,x2∗m−p1)
Income Changes
How does x1∗(p1,p2,m) change as y changes, holding other variables constant?
Note that changes in income do not change indifference curves; it only changes the budget constraint, changing the highest curve obtainable
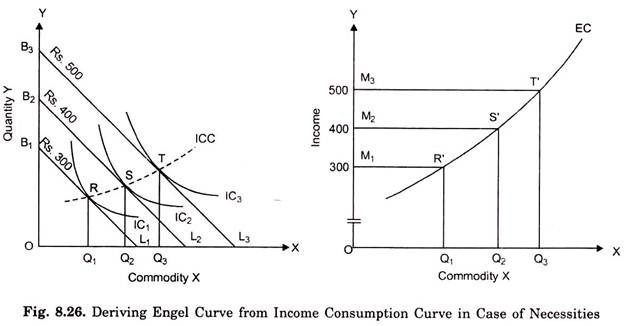
The curve containing the bundles that are demanded at different levels of income is known as the income offer curve (also known as the income expansion path)
Two graphs can then be drawn to find the optimal amounts of both good 1 and good 2
The graphs mapping income (on y-axis) to quantity (on x-axis) is known as the Engel curve
With Cobb-Douglas utility: u(x1,x2)=x1ax2bThe demand equations are (x1∗,x2∗)=((a+b)p1am,(a+b)p2bm)Isolating for m: m=(a(a+b)p1x1∗,b(a+b)p2x2∗)Note that m and the optimal amounts of either good are directly proportional to each other, so in a Cobb-Douglas scenario, the Engel curves are straight lines.
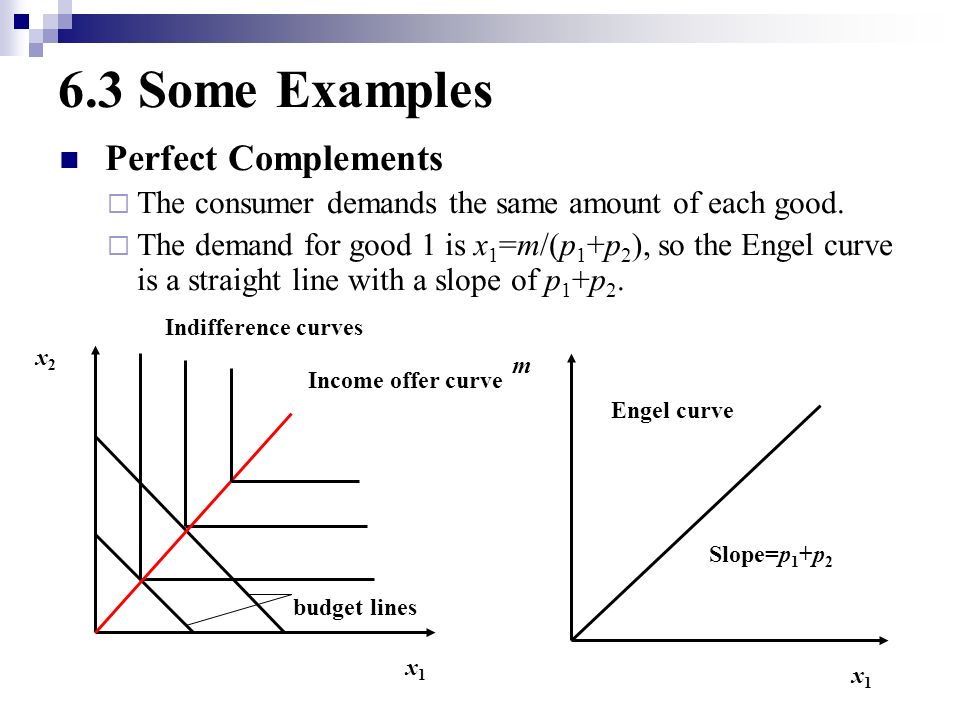
With perfect complements: u(x1,x2)=min{x1,x2}The demand function looks like (x1∗,x2∗)=(p1+p2m,p1+p2m)Isolating for m: m=((p1+p2)x1∗,(p1+p2)x2∗)Note that m and the optimal amounts of either good are directly proportional to each other, so in a Cobb-Douglas scenario, the Engel curves are straight lines.
With perfect substitutes: u(x1,x2)=x1+x2The demand function looks like: x1∗(p1,p2,y)={0,y/p1,if p1>p2if p1<p2}x2∗(p1,p2,y)={0,y/p2,if p1<p2if p1>p2}Suppose p1<p2. Then, x1∗=p1m,x2∗=0→m=p1x1∗,x2∗=0The opposite happens if p2>p1
In all of the examples so far, the Engel curves have been straight lines, but this isn’t always the case
Engel curves are only straight lines if the consumer’s preferences are homothetic
Homothetic preferences are preferences in which the demand for any good goes up by the same proportion as income
Luxury goods: demand for the good goes up by a greater proportion than income
Necessary good: demand for the good goes up by a smaller proportion than income