Demand Chapter
Own-Price Changes
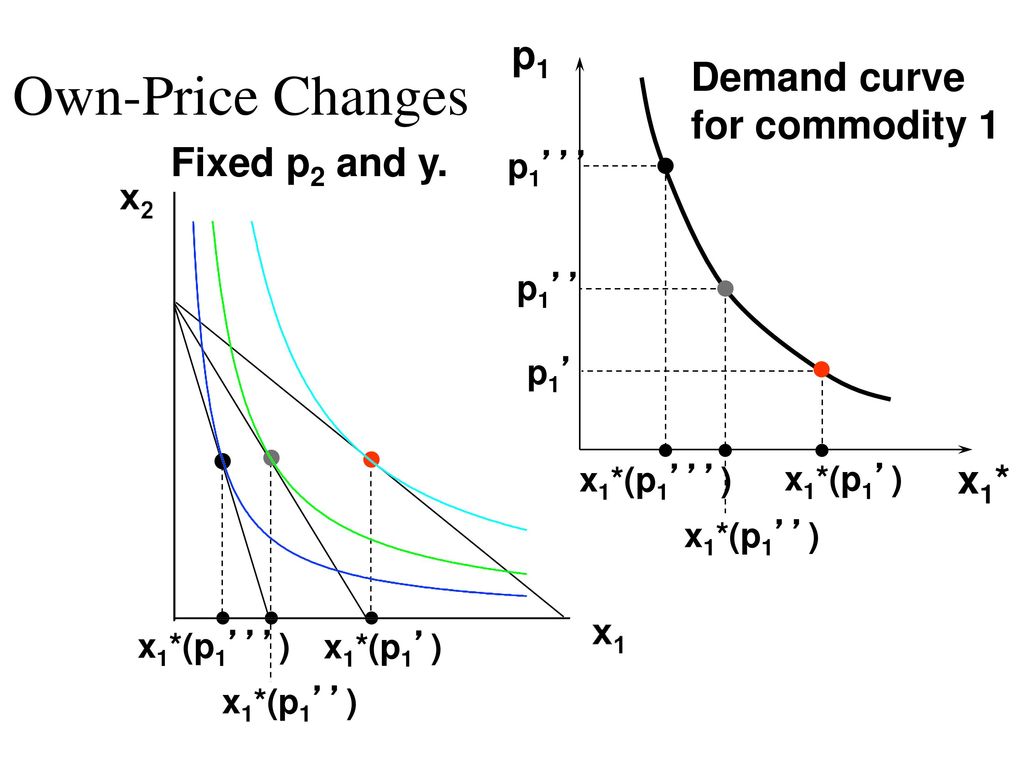
How does x1∗(p1,p2,y) change as p1 changes, holding p2 and y constant?Suppose p1 increases from p1′ to p2′ to p3′
The following graphic has two curves. The curve containing all the utility maximizing bundles as p1 changes with p2 and y constant is the p1 price offer curve. The other graph plotting the x1 coordinate of the p1 price offer curve against p1 is the demand curve for good 1.

As the graph shows, the more that p1 increases, the optimal amounts of good 1 and good 2 decrease. This is because the budget set becomes increasingly smaller.
Perfect Complements
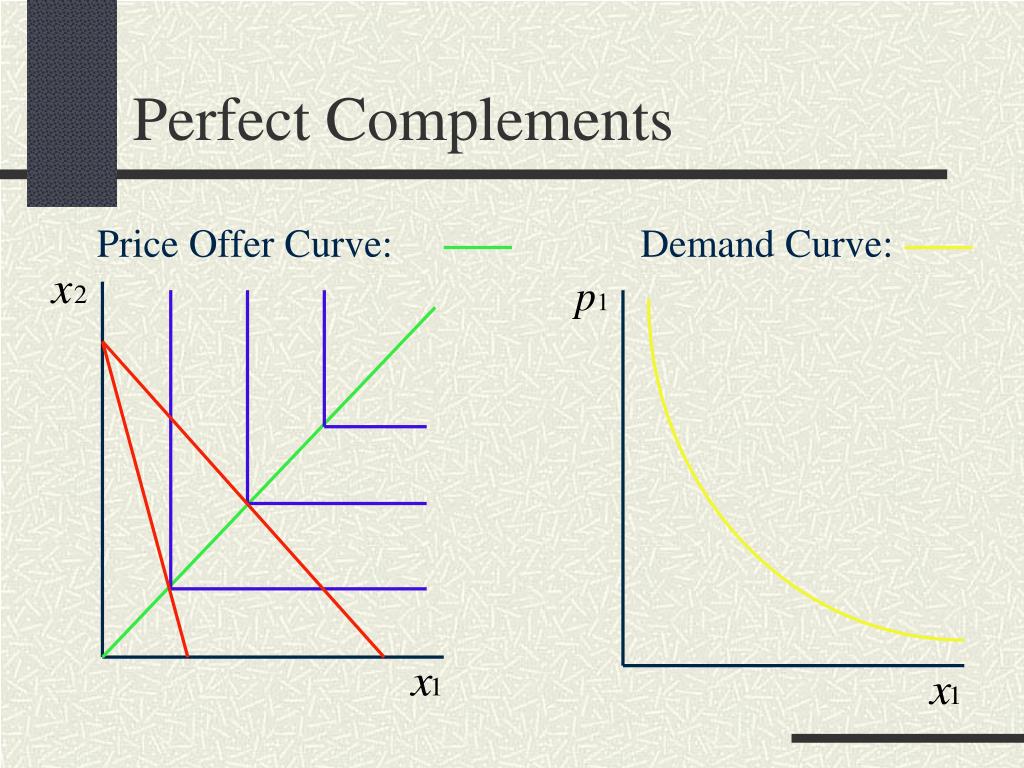
The p1 price offer curve for a perfect utility function would be a straight line in the form of x2 = ax1, as the bundles on that line will always be chosen as optimal bundles. The demand curve would have an x-intercept at y/p2 and no vertical intercept.

Assuming that a = 1, the optimal amounts of goods 1 and 2 are: x1∗(p1,p2,y)=x2∗(p1,p2,y)=p1+p2yAs x1→0,x1∗=x2∗→p2yAs x1→∞,x1∗=x2∗→0
Perfect Substitutes
The optimal amounts of the goods are given by the following:
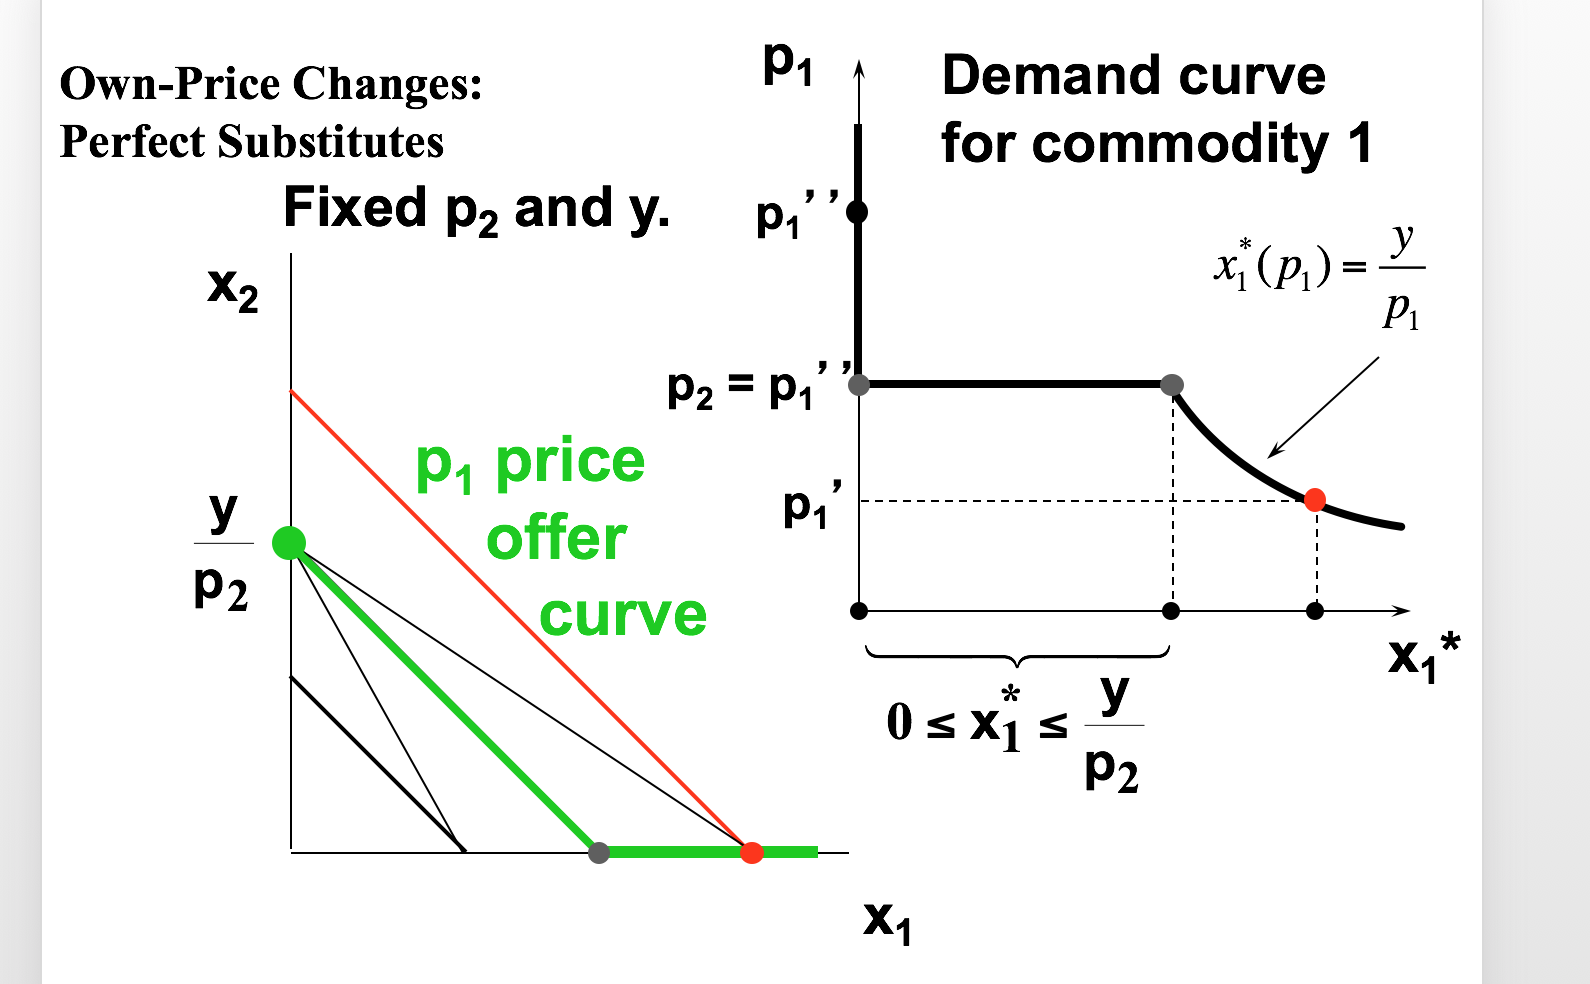
x1∗(p1,p2,y)={0,y/p1,if p1>p2if p1<p2}x2∗(p1,p2,y)={0,y/p2,if p1<p2if p1>p2}

- The price offer curve has three pieces; when p1 > p2, p1 == p2, and p1 < p2
- Note how the p1 < p2 case resembles the Cobb-Douglas indifference curve; this is because you are buying x1 such that x1p1 = y, which is the same as the Cobb-Douglas curves


