Preference Relations
Econ 105A
Assuptions About Preference Relations
- Completeness: The set of preference relations is complete; that is, for any two bundles x and y, it is always possible to make the statement that x is weakly preferred to y, y is weakly preferred to x, or both
- Reflexivity: Preferences need to be reflexive; that is, any bundle x is at least as good as itself, or x is weakly preferred to x for all x
- Transitivity: Preferences need to be transitive; that is, if x is weakly preferred to y, and y is weakly preferred to z, then x is weakly preferred to z
- Preference relations can be though of as a directed graph, where each node is a bundle and each directed edge represents weak preference
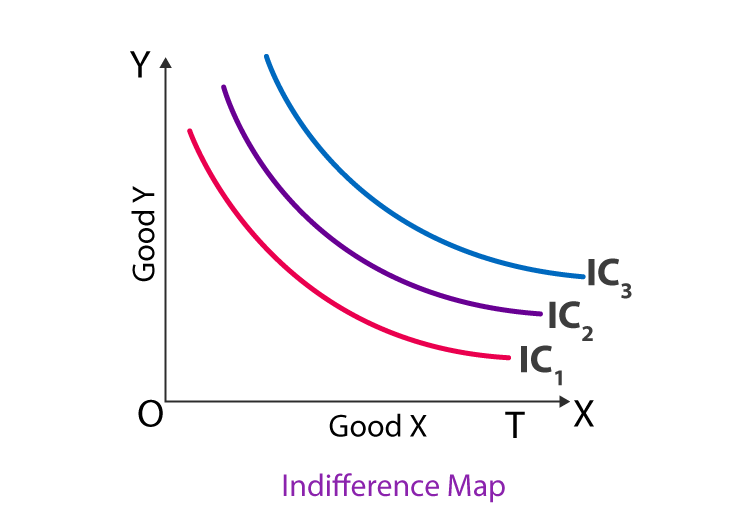
Indifference Curve
- In order to graph bundles on two dimensions as opposed to three (utility, x, and y), indifference curves are implemented

- Because we assume that consumers are rational, any sets that are strictly preferred to x must not be affordable, as they would purchase the bundles that make them better off
- By definition, indifference curves cannot intersect, as having a “shared bundle” would mean that all of the bundles in both curves are equally preferred to that bundle and thus each other, making them the same curve
Slopes of Indifference Curves
- When more of a commodity is always preferred, the commodity is a good
- If every commodity is a good, then the ICs are negatively sloped
- Intuitively, this makes sense; going up/right would give you better bundles (not the same) and going left/down would give you worse bundles (not the same). Thus, indifference curves must be negatively sloped downwards and to the right so bundles have the same preference
- When less of a commodity is always preferred, the commodity is a bad
- If every commodity is a bad, then the ICs are still negatively sloped by the same logic for if every commodity was a good
- If one commodity is a bad and the other is a good, then the ICs will be positively sloped
- Going up/left would make you better off while going right/down would make you worse off, so the IC must go up and to the right
Perfect Substitutes
- If a consumer regards units of commodities 1 and 2 as equivalent, then the commodities are perfect substitutes
- Because the commodities can be swapped out, the total amount of the two commodities determines the rank order of the bundles, meaning that only one value represents each indifference curve and that said curve can be graphed in one dimension
- Graphing the ICs of perfect substitutes in two dimensions will reveal that all of their slopes are constantly -1, making them all parallel

Perfect Complements
- If a consumer always consumes units of commodities 1 and 2 in fixed proportion (such as 1 to 1), then the commodities are perfect complements
- Because the commodities are always consumed in the same proportion, the number of pairs/combos that you can make in said proportion determines the ranked order of the bundles (AKA determined by the “limiting reactant”)
- For example, if two goods are consumed in a one-to-one ratio, then the bundles (5, 5), (5, 9), and (6, 5) would all be ranked equally
- Graphing the ICs of perfect complements in two dimensions will create L-shaped curves
